

signal strength 1 of 5

The Bearish Flag pattern has been formed on the chart #INTC M5. Therefore, the downwards trend is likely to continue in the nearest term. As soon as the price breaks below the low at 24.13, traders should enter the market.
The M5 and M15 time frames may have more false entry points.
- All
- Double Top
- Flag
- Head and Shoulders
- Pennant
- Rectangle
- Triangle
- Triple top
- All
- #AAPL
- #AMZN
- #Bitcoin
- #EBAY
- #FB
- #GOOG
- #INTC
- #KO
- #MA
- #MCD
- #MSFT
- #NTDOY
- #PEP
- #TSLA
- #TWTR
- AUDCAD
- AUDCHF
- AUDJPY
- AUDUSD
- EURCAD
- EURCHF
- EURGBP
- EURJPY
- EURNZD
- EURRUB
- EURUSD
- GBPAUD
- GBPCHF
- GBPJPY
- GBPUSD
- GOLD
- NZDCAD
- NZDCHF
- NZDJPY
- NZDUSD
- SILVER
- USDCAD
- USDCHF
- USDJPY
- USDRUB
- All
- M5
- M15
- M30
- H1
- D1
- All
- Buy
- Sale
- All
- 1
- 2
- 3
- 4
- 5
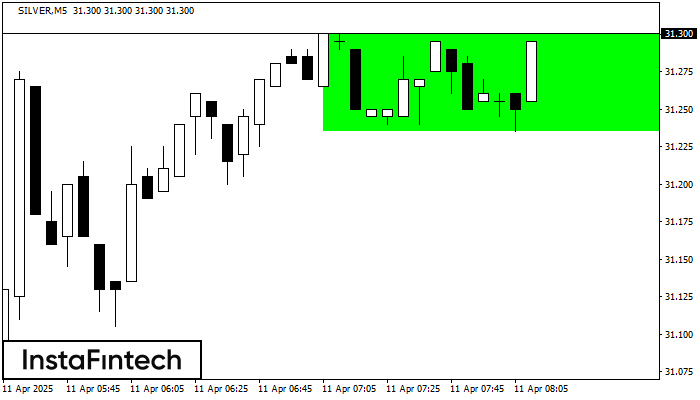
De acordo com o gráfico de M5, SILVER formou Retângulo de alta. O padrão indica uma continuação da tendência. O limite superior é 31.30, o limite inferior é 31.23
Os intervalos M5 e M15 podem ter mais pontos de entrada falsos.
Open chart in a new window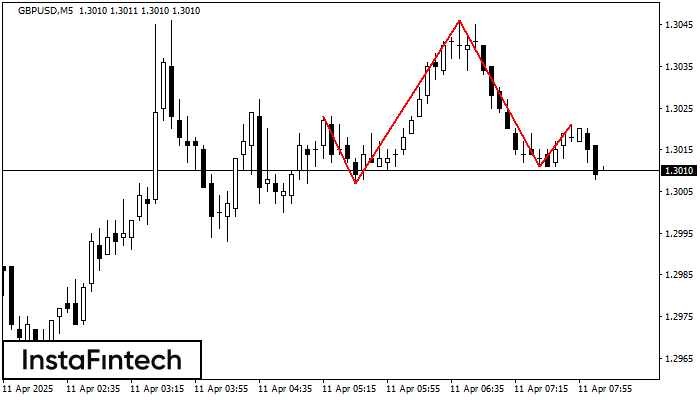
De acordo com o gráfico de M5, GBPUSD formou o padrão Cabeça & Ombros. O topo da Cabeça está definido em 1.3046 enquanto a linha mediana do Pescoço é encontrada
Os intervalos M5 e M15 podem ter mais pontos de entrada falsos.
Open chart in a new window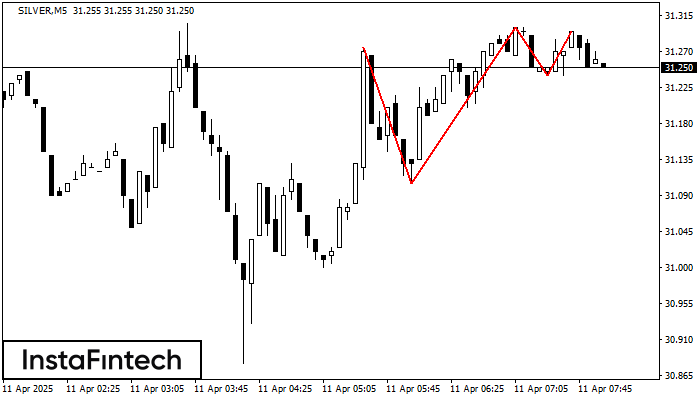
O padrão Topo triplo se formou no gráfico de SILVER M5. Características do padrão: os limites têm um ângulo ascendente; a linha inferior do padrão tem as coordenadas 31.11/31.24
Os intervalos M5 e M15 podem ter mais pontos de entrada falsos.
Open chart in a new window


