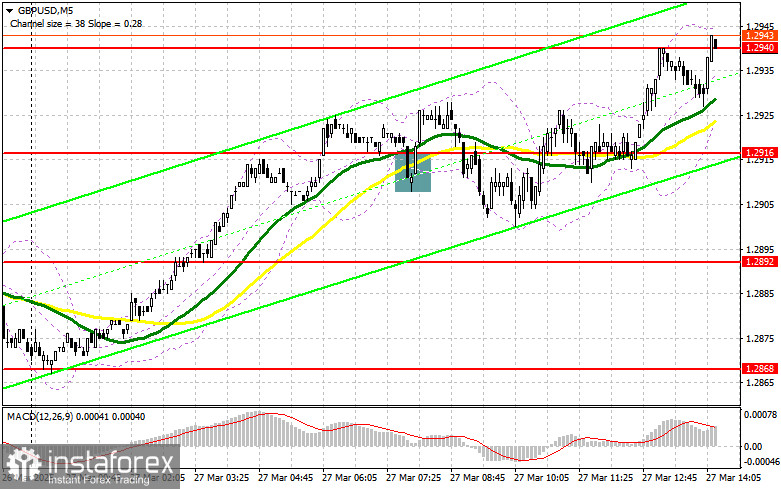
In my morning forecast, I focused on the 1.2916 level and planned to make trading decisions based on it. Let's look at the 5-minute chart and see what happened. A breakout and retest of 1.2916 provided an entry point for buying the pound, but the pair only climbed 10 points, and I didn't manage to catch a proper upward move. The technical outlook was revised for the second half of the day.
To open long positions on GBP/USD:
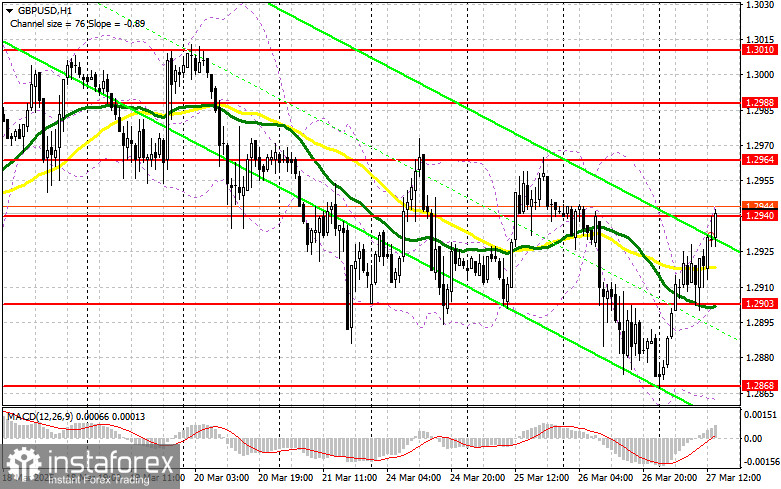
The lack of UK statistics allowed the pound to rise, continuing the Asian correction observed earlier in the day. Now the focus shifts to U.S. data: Q4 GDP revisions, the core personal consumption expenditures index, and weekly jobless claims. In addition to macroeconomic data, close attention will be paid to the speech by FOMC member Thomas Barkin. His comments on the current economic situation and the Fed's monetary policy outlook could bring back demand for the dollar. In case of a decline in the pair, it's best to act near the nearest support at 1.2903, formed in the first half of the day. A false breakout there will offer a good entry point into long positions with a target of recovery toward the 1.2940 resistance. A breakout with a retest of this range from top to bottom will offer a new entry point into long positions with the prospect of retesting 1.2964. The furthest target will be the 1.2988 area, where I will take profit. If GBP/USD declines and there is no bullish activity at 1.2903 in the second half of the day, pressure on the pound will return, locking the pair within a sideways channel. In that case, a false breakout around 1.2868 will offer a suitable condition for opening long positions. I plan to buy GBP/USD immediately on a rebound from 1.2835, aiming for a 30–35 point intraday correction.
To open short positions on GBP/USD:
The pound continues to recover after yesterday's unexpected sell-off triggered by Donald Trump's actions. Considering how quickly the pair was bought back, it's clear that large players are present in the market, so caution is needed with shorts. A false breakout around 1.2940 will provide a selling point aimed at pushing the pair down to the new support at 1.2903, which also aligns with the moving averages favoring buyers. A breakout and retest from below will trigger stop-loss orders and open the way toward 1.2868, which would invalidate buyers' recovery attempts. The final target will be the 1.2837 area, where I plan to take profit. Testing this level will restore the bearish market. If demand for the pound returns later in the day and bears show no activity around 1.2940, selling should be postponed until a test of the 1.2964 resistance level. I will open short positions there only on a false breakout. If there is no downward movement there either, I will look for short entries on a rebound from 1.2988, aiming for a 30–35 point correction.
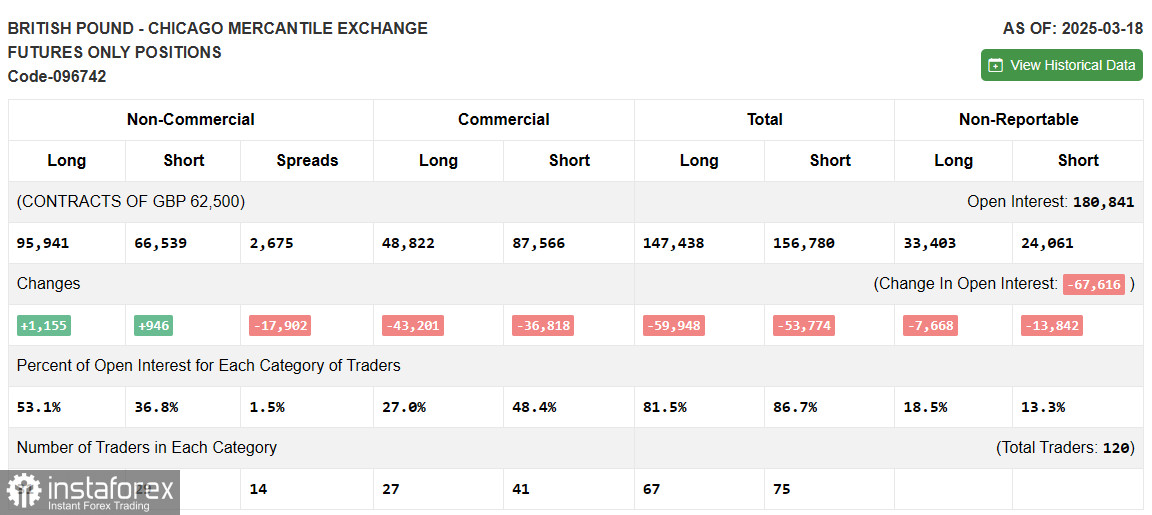
In the COT (Commitment of Traders) report dated March 18, both long and short positions increased. Longs grew significantly more, giving pound buyers a stronger edge. This is confirmed by the GBP/USD chart. The Bank of England's meeting showed a more gradual approach to rate cuts, and it's likely the stance will become even more hawkish. Many are concerned about Trump's actions and tariffs, which could trigger an inflation spike — already a sensitive issue in the UK. The BoE's current position benefits pound buyers and will continue to support them. The latest COT report shows that long non-commercial positions rose by 1,155 to 95,941, while short non-commercial positions increased by only 946 to 66,539. As a result, the gap between long and short positions narrowed by 17,902.
Indicator Signals:
Moving Averages: Trading is occurring near the 30- and 50-period moving averages, indicating market indecision.
Note: The periods and prices of moving averages are based on the H1 chart as used by the author and differ from the standard daily averages on the D1 chart.
Bollinger Bands: In the event of a decline, the lower boundary of the indicator around 1.2868 will serve as support.
Indicator Descriptions: • Moving average: Smooths volatility and noise to determine the current trend. Period 50 (yellow), Period 30 (green). • MACD (Moving Average Convergence/Divergence): Fast EMA – 12, Slow EMA – 26, Signal line SMA – 9. • Bollinger Bands: Period 20. • Non-commercial traders: Speculators such as individual traders, hedge funds, and large institutions using the futures market for speculative purposes and meeting certain criteria. • Long non-commercial positions: Total open long positions held by non-commercial traders. • Short non-commercial positions: Total open short positions held by non-commercial traders. • Net non-commercial position: The difference between non-commercial long and short positions.