signal strength 1 of 5
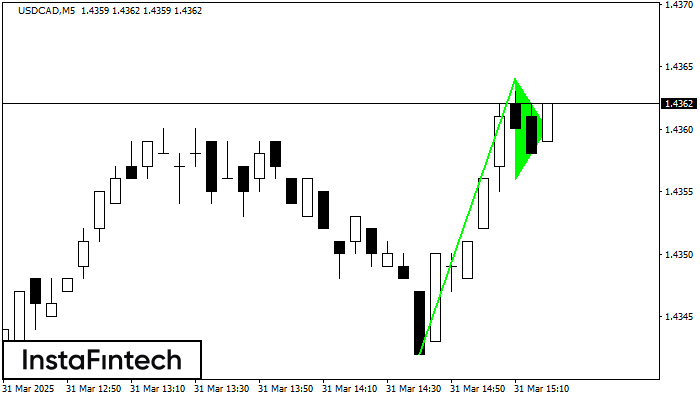
The Bullish pennant pattern is formed on the USDCAD M5 chart. It is a type of the continuation pattern. Supposedly, in case the price is fixed above the pennant’s high of 1.4364, a further uptrend is possible.
The M5 and M15 time frames may have more false entry points.
- All
- Double Top
- Flag
- Head and Shoulders
- Pennant
- Rectangle
- Triangle
- Triple top
- All
- #AAPL
- #AMZN
- #Bitcoin
- #EBAY
- #FB
- #GOOG
- #INTC
- #KO
- #MA
- #MCD
- #MSFT
- #NTDOY
- #PEP
- #TSLA
- #TWTR
- AUDCAD
- AUDCHF
- AUDJPY
- AUDUSD
- EURCAD
- EURCHF
- EURGBP
- EURJPY
- EURNZD
- EURRUB
- EURUSD
- GBPAUD
- GBPCHF
- GBPJPY
- GBPUSD
- GOLD
- NZDCAD
- NZDCHF
- NZDJPY
- NZDUSD
- SILVER
- USDCAD
- USDCHF
- USDJPY
- USDRUB
- All
- M5
- M15
- M30
- H1
- D1
- All
- Buy
- Sale
- All
- 1
- 2
- 3
- 4
- 5
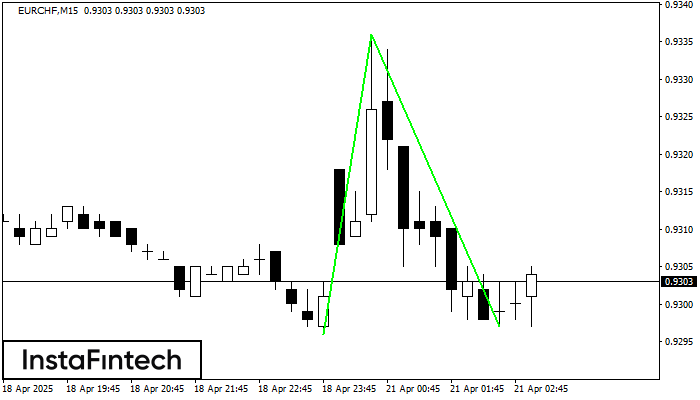
The Double Bottom pattern has been formed on EURCHF M15. Characteristics: the support level 0.9296; the resistance level 0.9336; the width of the pattern 40 points. If the resistance level
The M5 and M15 time frames may have more false entry points.
Open chart in a new window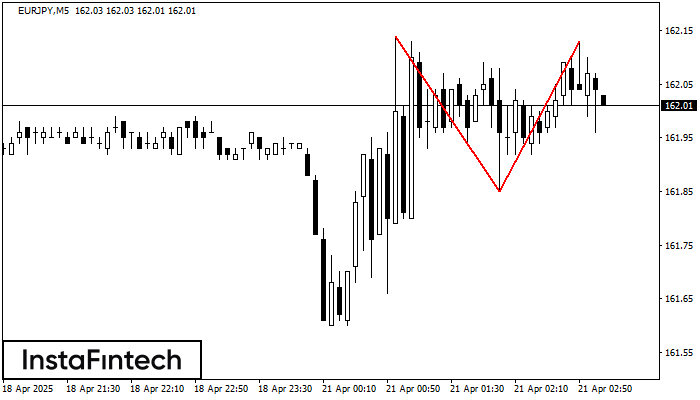
The Double Top pattern has been formed on EURJPY M5. It signals that the trend has been changed from upwards to downwards. Probably, if the base of the pattern 161.85
The M5 and M15 time frames may have more false entry points.
Open chart in a new window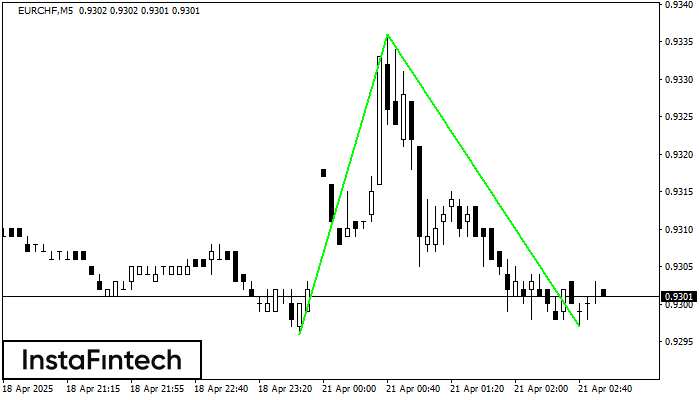
The Double Bottom pattern has been formed on EURCHF M5. Characteristics: the support level 0.9296; the resistance level 0.9336; the width of the pattern 40 points. If the resistance level
The M5 and M15 time frames may have more false entry points.
Open chart in a new window