GBP/USD
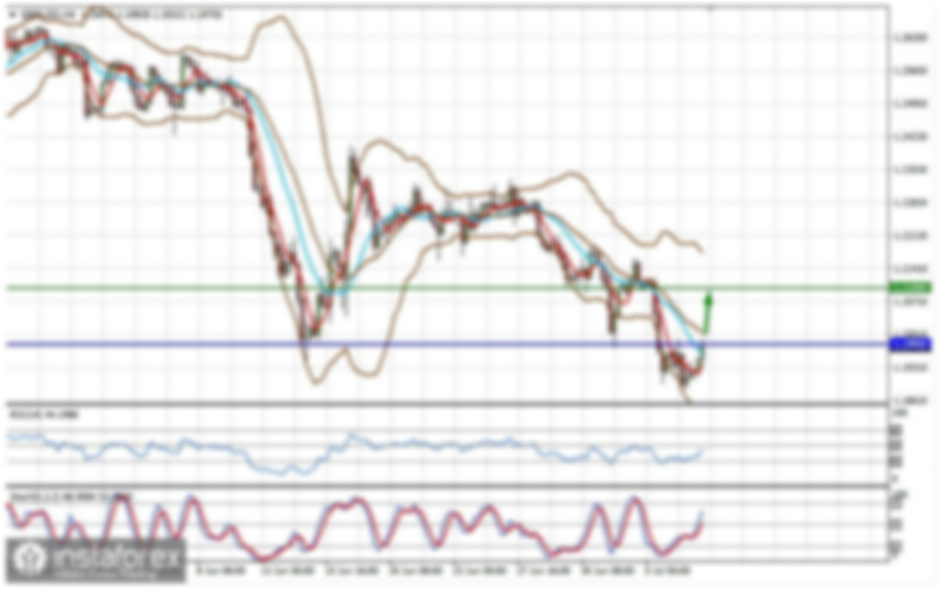
Analysis: The major pair of the British pound continues its upward movement on the price chart. The structure of the trend wave at the time of analysis is not completed. Since mid-July, the pair's price has moved sideways from the resistance zone, forming an intermediate correction. In recent days, the price has been pulling back from strong resistance.
Forecast: During the upcoming weekly period, the completion of the bearish movement is expected. In the area of calculated support, a reversal and resumption of the pair's upward movement should be awaited. The boundaries of the expected weekly movement are defined by calculated zones.
Potential Reversal Zones:
Resistance: 1.2940/1.2990
Support: 1.2680/1.2630
Recommendations:
Purchases: Will become possible after confirmed signals appear in the support area using your trading systems.
Sales: Will be safer within a single session using a reduced volume.
AUD/USD
Analysis: The unfinished segment of the dominant downward wave trend of the Australian dollar has been ongoing since July 11. In recent days, the quotes have drifted mostly sideways, forming the middle part of this wave construction. Its structure lacks the final upward segment. The price is moving along the upper boundary of intermediate resistance.
Forecast: In the coming days, the completion of the bearish movement in the support zone area is expected. Afterward, a change of direction and resumption of the upward vector, with a rise to the calculated resistance area, should be awaited.
Potential Reversal Zones:
Resistance: 0.6590/0.6640
Support: 0.6450/0.6400
Recommendations:
Sales: High-risk and may lead to loss of the deposit.
Purchases: Can be used in trading after corresponding signals appear in the resistance zone area of your TF.
USD/CHF
Analysis: On the chart of the major USD/CHF pair, the direction of the short-term trend since May is set by a downward wave. Analysis of its structure shows the formation of the final segment. Quotes have entered the zone of potential daily TF reversal, approaching its lower boundary. The wave structure shows completion, but no formed reversal signals are observed.
Forecast: In the coming days, the completion of the bearish movement in the support zone area can be expected. The second half of the week is anticipated to be more volatile, with a change of direction and resumption of price growth, up to the boundaries of calculated resistance.
Potential Reversal Zones:
Resistance: 0.8860/0.8910
Support: 0.8570/0.8520
Recommendations:
Purchases: Premature until confirmed signals appear in the resistance zone area of your trading systems.
Sales: No conditions for transactions in the Swiss franc market.
EUR/JPY
Analysis: The short-term trend of the EUR/JPY pair is downward. The unfinished wave segment started on July 30. Its structure currently appears completed. Quotes have reached the zone of potential reversal at the H4 scale, but no signals of an imminent course change are observed on the chart.
Forecast: During the coming days, price movement along the upper boundary of the powerful support zone is likely. Pressure on the zone and even a temporary breach of its lower boundary are possible. Then, a resumption of price growth and an increase to the calculated resistance can be expected.
Potential Reversal Zones:
Resistance: 162.50/163.00
Support: 159.40/158.90
Recommendations:
Sales: Very risky and may become unprofitable.
Purchases: Can be used in transactions after confirmed reversal signals appear in the calculated support zone on your TS.
AUD/JPY
Analysis: The direction of the trend of the AUD/JPY pair since the end of March this year is set by an upward wave algorithm. Since the end of April, a corrective extended flat has been forming on the chart of the pair. The wave structure has entered its final phase.
Forecast: In the upcoming week, the movement of quotes is expected within a narrow price channel between the nearest counter-directional zones. The first few days are more likely to have a downward vector. Pressure on the lower boundary of support is possible. Increased volatility and course of the pair can be expected closer to the weekend.
Potential Reversal Zones:
Resistance: 100.00/100.50
Support: 94.70/94.20
Recommendations:
Sales: Possible by fractional volume within individual sessions. Potential is limited by support.
Purchases: Will become relevant after corresponding confirmed reversal signals appear in the support area.
EUR/CHF
Analysis: Since the end of May this year, the quotes of the EUR/CHF pair began their movement "south" on the price chart. The price approaches the upper boundary of major TF support. The wave structure appears completed, without ready signals of an imminent reversal.
Forecast: At the beginning of the upcoming week, the continuation of the price movement downward, into the calculated support area, is expected. In the second half, the likelihood of forming a reversal and changing direction to an upward vector increases. Calculated zones demonstrate the range of the expected weekly movement of the pair.
Potential Reversal Zones:
Resistance: 0.9480/0.9530
Support: 0.9320/0.9270
Recommendations:
Sales: Can be used in trading by fractional volume within individual sessions.
Purchases: Premature until confirmed signals appear in the support area.
US Dollar Index
Analysis: The US dollar index continues its decline on the chart. The last segment started on June 28. In its structure, from the powerful resistance zone, quotes have been pulling back in the last week, forming the final part of the movement. After its complete completion, a change of direction of the index can be expected.
Forecast: At the beginning of the upcoming week, predominantly sideways movement of the quotes, with a downward vector, is expected. A decrease to the support zone is most likely. Pressure on it, with a temporary breach of its lower boundary, is not excluded. Afterwards, a reversal and resumption of the rate of rise to the upper boundary of the expected price channel can be expected.
Potential Reversal Zones:
Resistance: 103.70/103.90
Support: 102.70/102.50
Recommendations: The period of weakening positions of the US dollar in major pairs is close to completion. In the coming days, you can start tracking signals for resuming sales of national currencies in the majors.
Notes: In simplified wave analysis (SWA), all waves consist of 3 parts (A-B-C). Only the last, unfinished wave is analyzed on each TF. The solid background of arrows shows the formed structure, dotted - expected movements.
Attention: The wave algorithm does not account for the duration of instrument movements over time!