signal strength 1 of 5
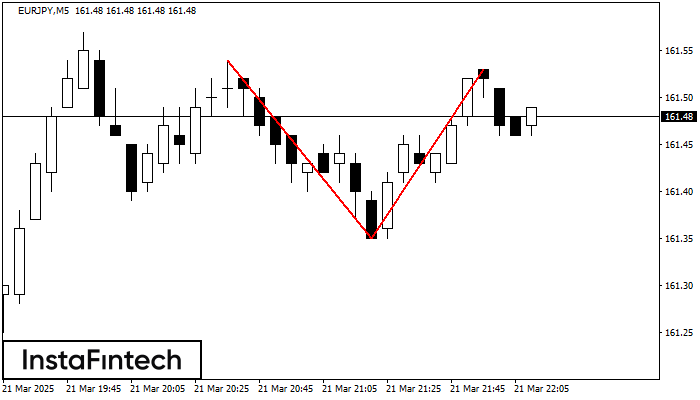
The Double Top reversal pattern has been formed on EURJPY M5. Characteristics: the upper boundary 161.54; the lower boundary 161.35; the width of the pattern is 18 points. Sell trades are better to be opened below the lower boundary 161.35 with a possible movements towards the 161.20 level.
The M5 and M15 time frames may have more false entry points.
- All
- Double Top
- Flag
- Head and Shoulders
- Pennant
- Rectangle
- Triangle
- Triple top
- All
- #AAPL
- #AMZN
- #Bitcoin
- #EBAY
- #FB
- #GOOG
- #INTC
- #KO
- #MA
- #MCD
- #MSFT
- #NTDOY
- #PEP
- #TSLA
- #TWTR
- AUDCAD
- AUDCHF
- AUDJPY
- AUDUSD
- EURCAD
- EURCHF
- EURGBP
- EURJPY
- EURNZD
- EURRUB
- EURUSD
- GBPAUD
- GBPCHF
- GBPJPY
- GBPUSD
- GOLD
- NZDCAD
- NZDCHF
- NZDJPY
- NZDUSD
- SILVER
- USDCAD
- USDCHF
- USDJPY
- USDRUB
- All
- M5
- M15
- M30
- H1
- D1
- All
- Buy
- Sale
- All
- 1
- 2
- 3
- 4
- 5
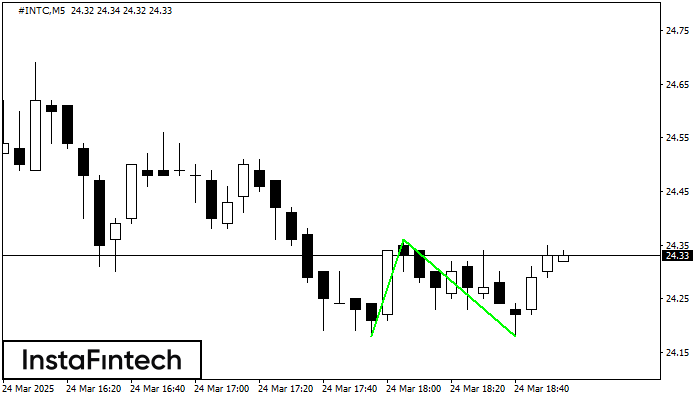
The Double Bottom pattern has been formed on #INTC M5. Characteristics: the support level 24.18; the resistance level 24.36; the width of the pattern 18 points. If the resistance level
The M5 and M15 time frames may have more false entry points.
Open chart in a new window
On the chart of #PEP M5 the Double Top reversal pattern has been formed. Characteristics: the upper boundary 146.13; the lower boundary 145.79; the width of the pattern 34 points
The M5 and M15 time frames may have more false entry points.
Open chart in a new window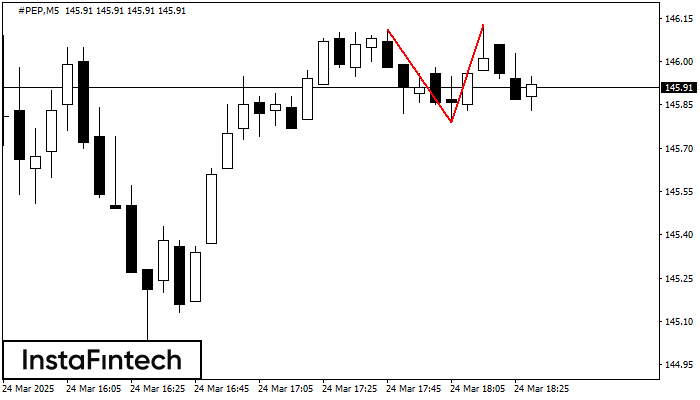
The Double Top reversal pattern has been formed on #PEP M5. Characteristics: the upper boundary 146.11; the lower boundary 145.79; the width of the pattern is 34 points. Sell trades
The M5 and M15 time frames may have more false entry points.
Open chart in a new window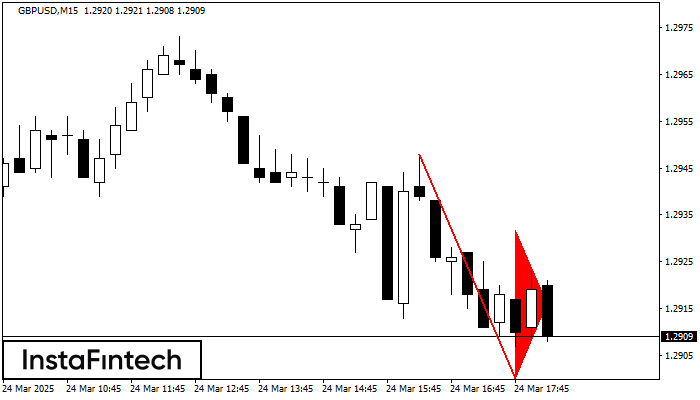
The Bearish pennant pattern has formed on the GBPUSD M15 chart. This pattern type is characterized by a slight slowdown after which the price will move in the direction
The M5 and M15 time frames may have more false entry points.
Open chart in a new window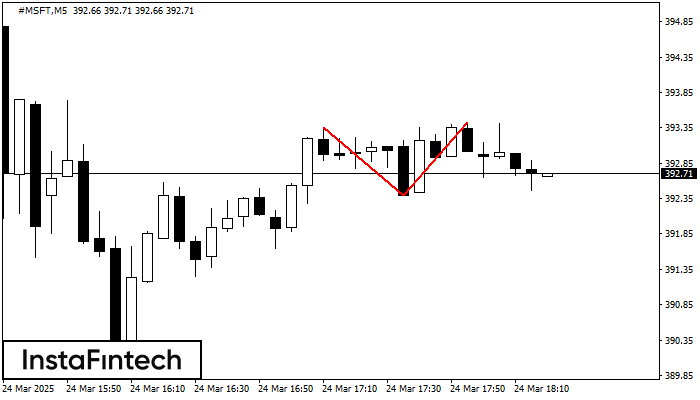
The Double Top pattern has been formed on #MSFT M5. It signals that the trend has been changed from upwards to downwards. Probably, if the base of the pattern 392.40
The M5 and M15 time frames may have more false entry points.
Open chart in a new window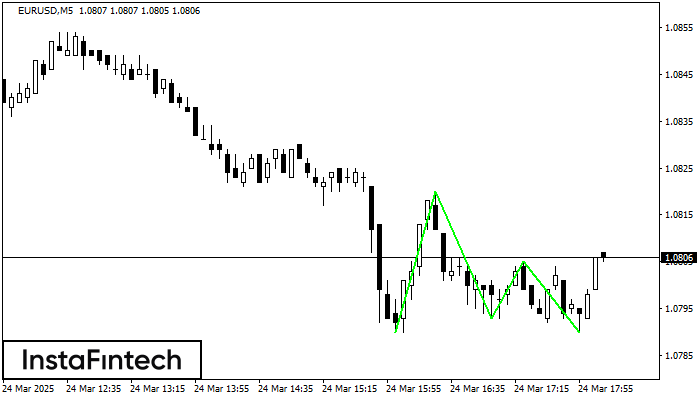
The Triple Bottom pattern has formed on the chart of the EURUSD M5 trading instrument. The pattern signals a change in the trend from downwards to upwards in the case
The M5 and M15 time frames may have more false entry points.
Open chart in a new window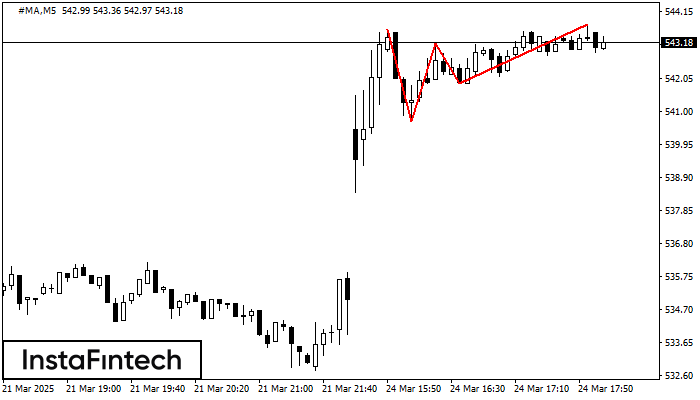
On the chart of the #MA M5 trading instrument, the Triple Top pattern that signals a trend change has formed. It is possible that after formation of the third peak
The M5 and M15 time frames may have more false entry points.
Open chart in a new window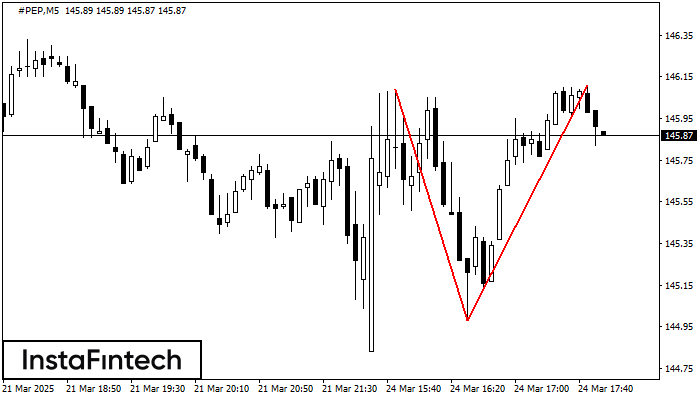
The Double Top reversal pattern has been formed on #PEP M5. Characteristics: the upper boundary 146.09; the lower boundary 144.98; the width of the pattern is 113 points. Sell trades
The M5 and M15 time frames may have more false entry points.
Open chart in a new window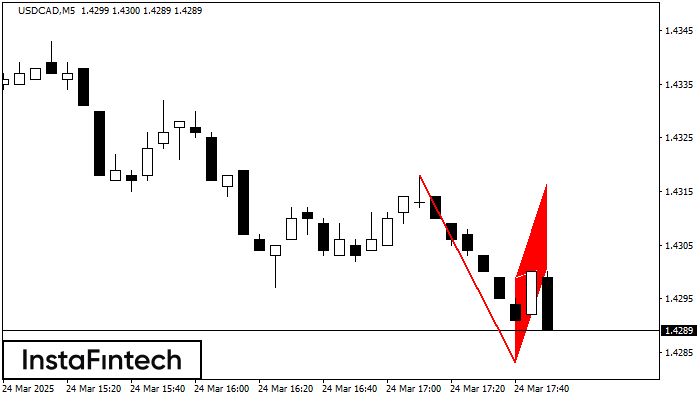
The Bearish Flag pattern has been formed on USDCAD at M5. The lower boundary of the pattern is located at 1.4283/1.4301 while the upper boundary lies at 1.4299/1.4317. The projection
The M5 and M15 time frames may have more false entry points.
Open chart in a new window