signal strength 2 of 5
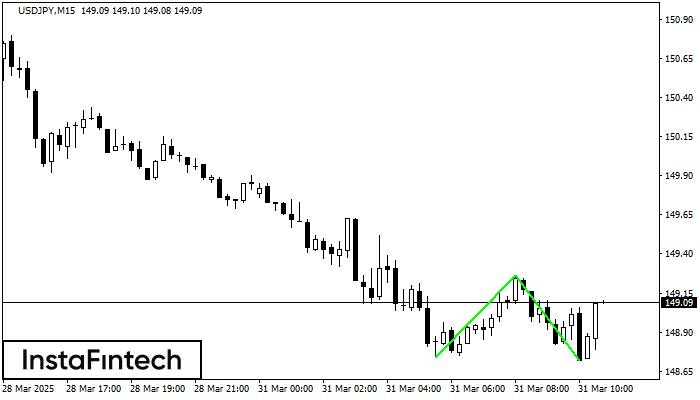
The Double Bottom pattern has been formed on USDJPY M15. Characteristics: the support level 148.74; the resistance level 149.26; the width of the pattern 52 points. If the resistance level is broken, a change in the trend can be predicted with the first target point lying at the distance of 54 points.
The M5 and M15 time frames may have more false entry points.
Veja também
- All
- Double Top
- Flag
- Head and Shoulders
- Pennant
- Rectangle
- Triangle
- Triple top
- All
- #AAPL
- #AMZN
- #Bitcoin
- #EBAY
- #FB
- #GOOG
- #INTC
- #KO
- #MA
- #MCD
- #MSFT
- #NTDOY
- #PEP
- #TSLA
- #TWTR
- AUDCAD
- AUDCHF
- AUDJPY
- AUDUSD
- EURCAD
- EURCHF
- EURGBP
- EURJPY
- EURNZD
- EURRUB
- EURUSD
- GBPAUD
- GBPCHF
- GBPJPY
- GBPUSD
- GOLD
- NZDCAD
- NZDCHF
- NZDJPY
- NZDUSD
- SILVER
- USDCAD
- USDCHF
- USDJPY
- USDRUB
- All
- M5
- M15
- M30
- H1
- D1
- All
- Buy
- Sale
- All
- 1
- 2
- 3
- 4
- 5

The Double Bottom pattern has been formed on #AAPL M5. This formation signals a reversal of the trend from downwards to upwards. The signal is that a buy trade should
The M5 and M15 time frames may have more false entry points.
Открыть график инструмента в новом окне
The Triple Bottom pattern has been formed on EURUSD M5. It has the following characteristics: resistance level 1.0936/1.0923; support level 1.0906/1.0904; the width is 30 points. In the event
The M5 and M15 time frames may have more false entry points.
Открыть график инструмента в новом окне
According to the chart of M5, #MCD formed the Bearish Symmetrical Triangle pattern. Description: The lower border is 290.72/297.52 and upper border is 306.36/297.52. The pattern width is measured
The M5 and M15 time frames may have more false entry points.
Открыть график инструмента в новом окне