signal strength 2 of 5
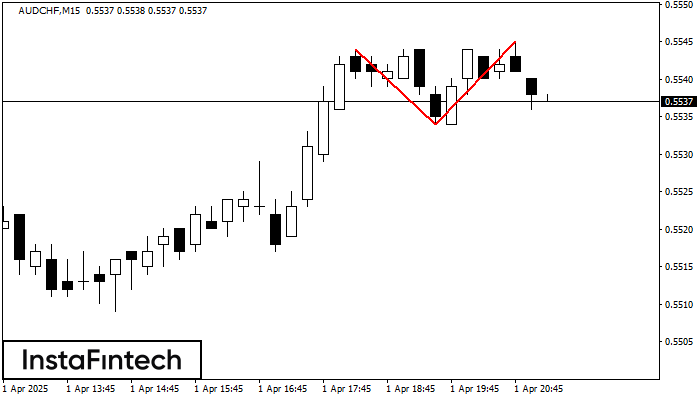
On the chart of AUDCHF M15 the Double Top reversal pattern has been formed. Characteristics: the upper boundary 0.5545; the lower boundary 0.5534; the width of the pattern 11 points. The signal: a break of the lower boundary will cause continuation of the downward trend targeting the 0.5512 level.
The M5 and M15 time frames may have more false entry points.
Veja também
- All
- Double Top
- Flag
- Head and Shoulders
- Pennant
- Rectangle
- Triangle
- Triple top
- All
- #AAPL
- #AMZN
- #Bitcoin
- #EBAY
- #FB
- #GOOG
- #INTC
- #KO
- #MA
- #MCD
- #MSFT
- #NTDOY
- #PEP
- #TSLA
- #TWTR
- AUDCAD
- AUDCHF
- AUDJPY
- AUDUSD
- EURCAD
- EURCHF
- EURGBP
- EURJPY
- EURNZD
- EURRUB
- EURUSD
- GBPAUD
- GBPCHF
- GBPJPY
- GBPUSD
- GOLD
- NZDCAD
- NZDCHF
- NZDJPY
- NZDUSD
- SILVER
- USDCAD
- USDCHF
- USDJPY
- USDRUB
- All
- M5
- M15
- M30
- H1
- D1
- All
- Buy
- Sale
- All
- 1
- 2
- 3
- 4
- 5
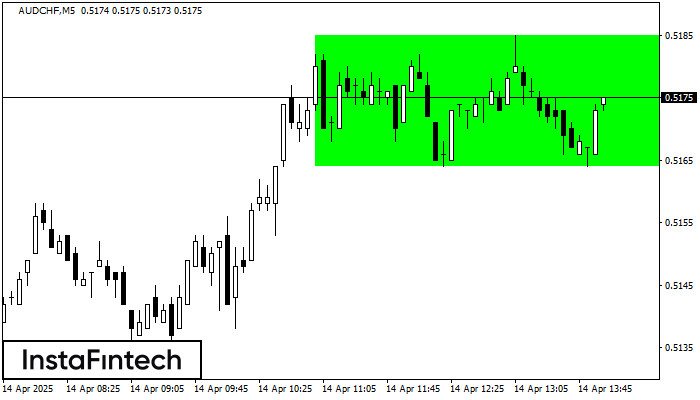
De acordo com o gráfico de M5, AUDCHF formou Retângulo de alta. O padrão indica uma continuação da tendência. O limite superior é 0.5185, o limite inferior é 0.5164
Os intervalos M5 e M15 podem ter mais pontos de entrada falsos.
Open chart in a new window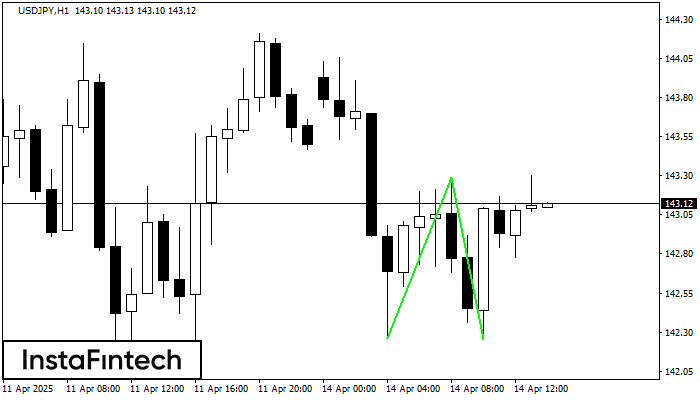
O padrão Fundo duplo foi formado em USDJPY H1. Características: o nível de suporte 142.26; o nível de resistência 143.29; a largura do padrão 103 pontos. Se o nível
Open chart in a new window
De acordo com o gráfico de M5, NZDJPY formaram o padrão de Triângulo Simétrico de Alta. Descrição: Este é o padrão de uma continuação de tendência. 84.17 e 83.88
Os intervalos M5 e M15 podem ter mais pontos de entrada falsos.
Open chart in a new window