signal strength 2 of 5
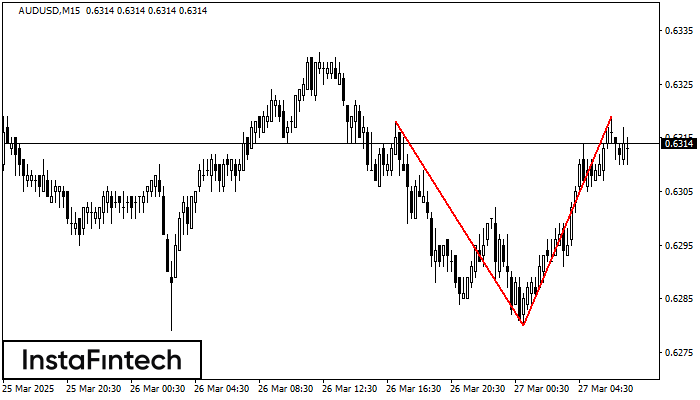
The Double Top pattern has been formed on AUDUSD M15. It signals that the trend has been changed from upwards to downwards. Probably, if the base of the pattern 0.6280 is broken, the downward movement will continue.
The M5 and M15 time frames may have more false entry points.
See Also
- All
- Double Top
- Flag
- Head and Shoulders
- Pennant
- Rectangle
- Triangle
- Triple top
- All
- #AAPL
- #AMZN
- #Bitcoin
- #EBAY
- #FB
- #GOOG
- #INTC
- #KO
- #MA
- #MCD
- #MSFT
- #NTDOY
- #PEP
- #TSLA
- #TWTR
- AUDCAD
- AUDCHF
- AUDJPY
- AUDUSD
- EURCAD
- EURCHF
- EURGBP
- EURJPY
- EURNZD
- EURRUB
- EURUSD
- GBPAUD
- GBPCHF
- GBPJPY
- GBPUSD
- GOLD
- NZDCAD
- NZDCHF
- NZDJPY
- NZDUSD
- SILVER
- USDCAD
- USDCHF
- USDJPY
- USDRUB
- All
- M5
- M15
- M30
- H1
- D1
- All
- Buy
- Sale
- All
- 1
- 2
- 3
- 4
- 5
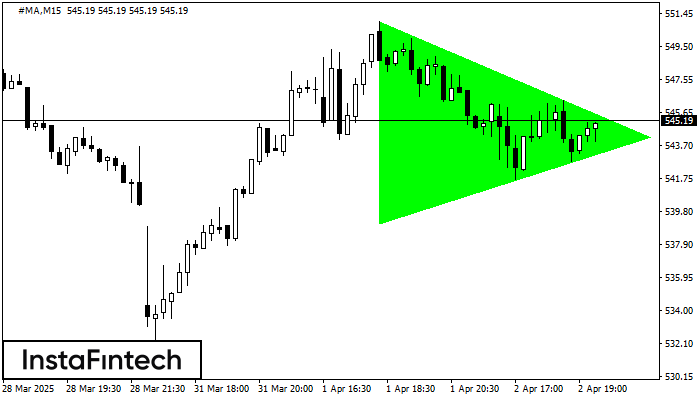
According to the chart of M15, #MA formed the Bullish Symmetrical Triangle pattern. The lower border of the pattern touches the coordinates 539.13/544.19 whereas the upper border goes across 550.97/544.19
The M5 and M15 time frames may have more false entry points.
Open chart in a new window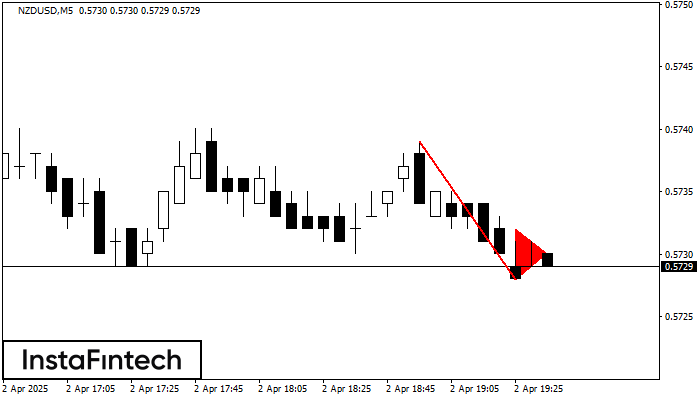
The Bearish pennant pattern has formed on the NZDUSD M5 chart. The pattern signals continuation of the downtrend in case the pennant’s low of 0.5728 is broken through. Recommendations: Place
The M5 and M15 time frames may have more false entry points.
Open chart in a new window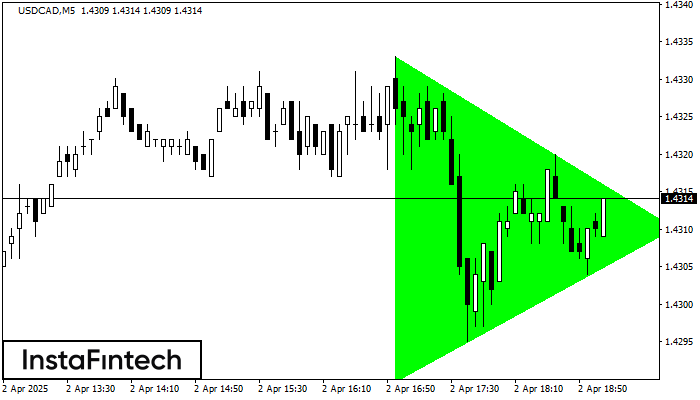
According to the chart of M5, USDCAD formed the Bullish Symmetrical Triangle pattern. Description: This is the pattern of a trend continuation. 1.4333 and 1.4290 are the coordinates
The M5 and M15 time frames may have more false entry points.
Open chart in a new window