EUR/USD
Analysis:
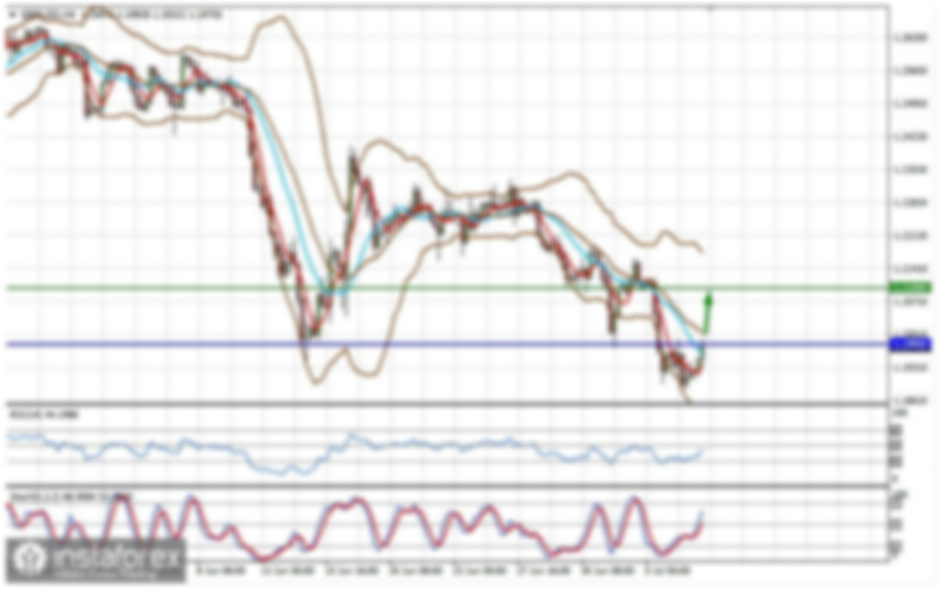
Since the end of August, the euro's price trend in its primary pair has followed a descending wave. On the daily chart, this section represents a correction to the previous upward trend. At the time of analysis, the wave structure remains incomplete. The final segment of the wave (part C) has been actively developing since November 5.
Forecast:
Early in the week, a sideways movement is expected, with the possibility of an upward vector toward the resistance zone. In the second half of the week, activation and a resumption of the downward trend are anticipated. While the nearest support may limit the pair's weekly range, it is unlikely to act as an insurmountable barrier.
Potential Reversal Zones:
- Resistance: 1.0600/1.0650
- Support: 1.0370/1.0320
Recommendations:
- Sales: After appropriate reversal signals appear near the resistance zone, they can be considered for trades.
- Buys: High-risk trades with a potential for losses.
USD/JPY
Analysis:
Since mid-summer, the Japanese yen's primary pair has been driven by an upward wave, which remains incomplete. Since November 5, a counter downward expanded flat has been forming within a sideways movement. The wave is now in its final phase. Projected support lies within a calculated potential reversal zone on the daily timeframe.
Forecast:
In the next couple of days, the price movement for the Japanese yen is expected to remain predominantly sideways along the resistance boundaries. A reversal and the resumption of the downward movement are highly probable. A breakout beyond the projected zones within the current week is unlikely.
Potential Reversal Zones:
- Resistance: 154.70/155.20
- Support: 151.70/151.20
Recommendations:
- Sales: Relevant after reversal signals appear near the resistance zone in your trading systems.
- Buys: Limited potential; may result in losses.
GBP/JPY
Analysis:
The short-term trend of the GBP/JPY pair has been guided by an upward wave since August 5. Since late August, the price has been forming an intermediate correction along a strong resistance zone. At the time of analysis, this correction remains incomplete.
Forecast:
In the coming days, the downward movement is expected to conclude near the support zone. By the weekend, a reversal and renewed growth toward resistance levels are likely. A breakout beyond the projected zones within the current week is unlikely.
Potential Reversal Zones:
- Resistance: 196.40/196.90
- Support: 193.50/193.00
Recommendations:
- Sales: Can be executed with small volume sizes during specific sessions, targeting the support zone.
- Buys: Relevant only after confirmed reversal signals at the support zone in your trading systems.
USD/CAD
Analysis:
Since the end of last year, the short-term trend for the Canadian dollar major pair has followed a bullish wave. This wave structure is still incomplete. The final segment has been forming since late September. Last week, the pair broke through intermediate resistance, which now acts as support.
Forecast:
At the start of the week, a general sideways movement is expected, with the possibility of a decline to the calculated support zone. Toward the end of the week, increased volatility and a resumption of the upward trend are more likely.
Potential Reversal Zones:
- Resistance: 1.4190/1.4240
- Support: 1.4040/1.3990
Recommendations:
- Buys: Relevant after appropriate reversal signals appear in your trading systems.
- Sales: Limited potential; may result in losses.
NZD/USD
Analysis:
Since December of last year, fluctuations in the New Zealand dollar have followed a downward wave structure. The pair has reached the upper boundary of a wide support zone on the daily timeframe. However, this wave structure remains incomplete. Last week, the pair consolidated horizontally along the support zone.
Forecast:
Early in the week, the sideways movement is likely to continue, with potential pressure on the lower boundary of the support zone. Later in the week, a reversal and growth in quotes are expected. This directional change is more probable in the second half of the week, coinciding with significant economic news releases.
Potential Reversal Zones:
- Resistance: 0.5980/0.6030
- Support: 0.5850/0.5800
Recommendations:
- Sales: Risky with low potential.
- Buys: Consider only after confirmed reversal signals at the support zone.
EUR/GBP
Analysis:
The incomplete portion of the dominant downward trend for the EUR/GBP pair has been in motion since August 5. The pair has transitioned from the upper to the lower boundary of a wide potential reversal zone on the weekly timeframe. An intermediate correction is developing and remains incomplete.
Forecast:
In the first half of the week, a sideways trend with an upward vector is expected. Price growth is unlikely to exceed the resistance zone. Later, the bearish trend is expected to resume. The calculated support zone marks the lower boundary of the expected weekly range.
Potential Reversal Zones:
- Resistance: 0.8450/0.8500
- Support: 0.8350/0.8300
Recommendations:
- Sales: Appropriate after corresponding signals near the resistance zone.
- Buys: Possible with reduced volume sizes during specific sessions; recommended to minimize trading size due to low potential.
Gold
Analysis:
In the short term, the price movement of gold since late October has been following a downward wave. On the daily chart, this wave is correcting the final segment of the dominant trend. The quotes are approaching the upper boundary of a calculated potential reversal zone on the higher timeframe.
Forecast:
Gold prices may continue to rise for the next couple of days, potentially testing the resistance zone. A brief breach of the upper boundary is possible. Following this, expect a sideways consolidation, setting the stage for a resumption of the downward trend. Increased volatility and a price decrease are likely closer to the weekend.
Potential Reversal Zones:
- Resistance: 2580.0/2600.0
- Support: 2500.0/2480.0
Recommendations:
- Sales: Consider after confirmed reversal signals near the resistance zone. The support zone will limit trade potential.
- Buys: Premature before the current decline concludes.
Bitcoin
Analysis:
The upward trend in the Bitcoin market has pushed prices to record highs. The next price surge target lies in a large potential reversal zone. Last week, after breaking an intermediate level, the price consolidated along the newly formed support. This structure remains incomplete.
Forecast:
For the next couple of days, the sideways trend is likely to continue. A subsequent price increase is expected, potentially reaching the resistance zone. By the weekend, a directional shift and a decline toward the support zone are anticipated.
Potential Reversal Zones:
- Resistance: 93,800.0/94,300.0
- Support: 87,000.0/86,500.0
Recommendations:
- Sales: Possible after confirmed signals near the resistance zone.
- Buys: Consider fractional volumes during specific sessions.
Explanations: In the simplified wave analysis (SWA), all waves consist of 3 parts (A-B-C). The last unfinished wave is analyzed on each timeframe. Expected movements are shown by dashed lines.
Attention: The wave algorithm does not take into account the duration of movements over time!