signal strength 1 of 5
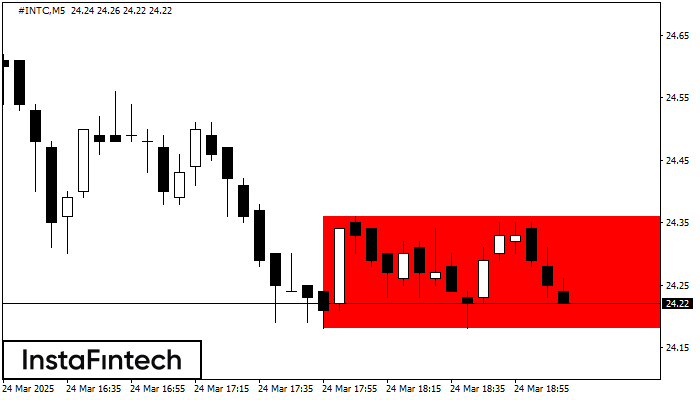
According to the chart of M5, #INTC formed the Bearish Rectangle. The pattern indicates a trend continuation. The upper border is 24.36, the lower border is 24.18. The signal means that a short position should be opened after fixing a price below the lower border 24.18 of the Bearish Rectangle.
The M5 and M15 time frames may have more false entry points.
Vea asimismo
- All
- Double Top
- Flag
- Head and Shoulders
- Pennant
- Rectangle
- Triangle
- Triple top
- All
- #AAPL
- #AMZN
- #Bitcoin
- #EBAY
- #FB
- #GOOG
- #INTC
- #KO
- #MA
- #MCD
- #MSFT
- #NTDOY
- #PEP
- #TSLA
- #TWTR
- AUDCAD
- AUDCHF
- AUDJPY
- AUDUSD
- EURCAD
- EURCHF
- EURGBP
- EURJPY
- EURNZD
- EURRUB
- EURUSD
- GBPAUD
- GBPCHF
- GBPJPY
- GBPUSD
- GOLD
- NZDCAD
- NZDCHF
- NZDJPY
- NZDUSD
- SILVER
- USDCAD
- USDCHF
- USDJPY
- USDRUB
- All
- M5
- M15
- M30
- H1
- D1
- All
- Buy
- Sale
- All
- 1
- 2
- 3
- 4
- 5
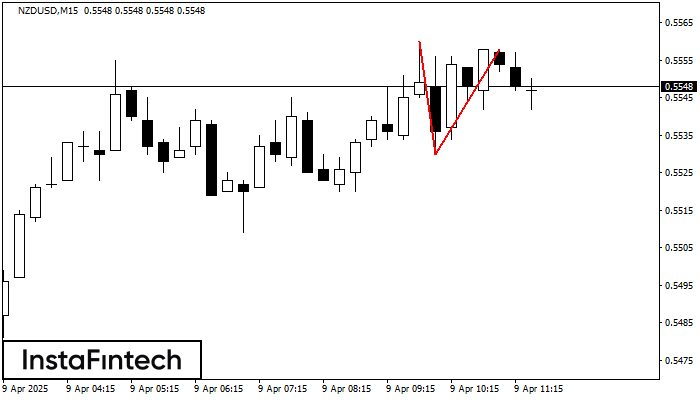
The Double Top pattern has been formed on NZDUSD M15. It signals that the trend has been changed from upwards to downwards. Probably, if the base of the pattern 0.5530
The M5 and M15 time frames may have more false entry points.
Open chart in a new window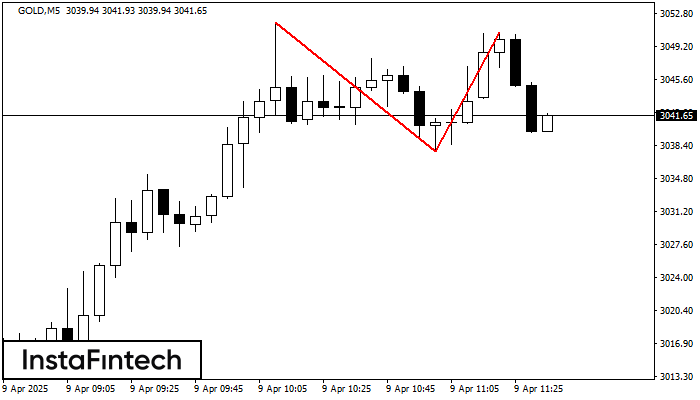
On the chart of GOLD M5 the Double Top reversal pattern has been formed. Characteristics: the upper boundary 3050.69; the lower boundary 3037.74; the width of the pattern 1295 points
The M5 and M15 time frames may have more false entry points.
Open chart in a new window
According to the chart of M15, NZDJPY formed the Bearish Symmetrical Triangle pattern. Description: The lower border is 79.77/80.40 and upper border is 81.02/80.40. The pattern width is measured
The M5 and M15 time frames may have more false entry points.
Open chart in a new window