сила сигнала 2 из 5
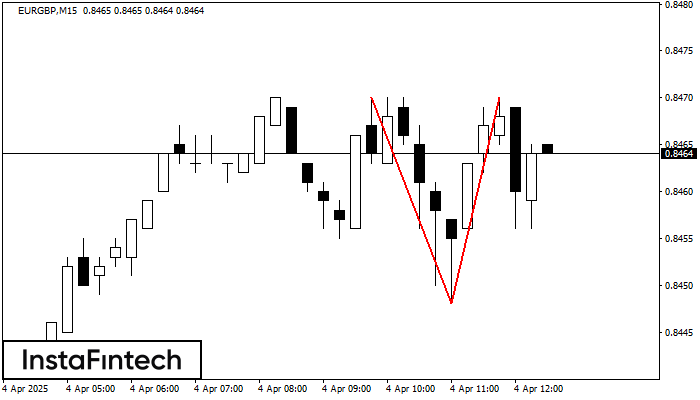
На торговом графике EURGBP M15 сформировалась разворотная фигура «Двойная вершина». Характеристика: Верхняя граница 0.8470; Нижняя граница 0.8448; Ширина фигуры 22 пунктов. Сигнал: Пробой нижней границы 0.8448 приведет к дальнейшему нисходящему движению с перспективой хода к уровню 0.8425.
Таймфреймы М5 и М15 могут иметь больше ложных точек входа.
Дивіться також
- Все
- Вымпел
- Голова и плечи
- Двойная вершина
- Прямоугольник
- Треугольник
- Тройная вершина
- Флаг
- Все
- #AAPL
- #AMZN
- #Bitcoin
- #EBAY
- #FB
- #GOOG
- #INTC
- #KO
- #MA
- #MCD
- #MSFT
- #NTDOY
- #PEP
- #TSLA
- #TWTR
- AUDCAD
- AUDCHF
- AUDJPY
- AUDUSD
- EURCAD
- EURCHF
- EURGBP
- EURJPY
- EURNZD
- EURRUB
- EURUSD
- GBPAUD
- GBPCHF
- GBPJPY
- GBPUSD
- GOLD
- NZDCAD
- NZDCHF
- NZDJPY
- NZDUSD
- SILVER
- USDCAD
- USDCHF
- USDJPY
- USDRUB
- Все
- M5
- M15
- M30
- H1
- D1
- Все
- Покупка
- Продажа
- Все
- 1
- 2
- 3
- 4
- 5
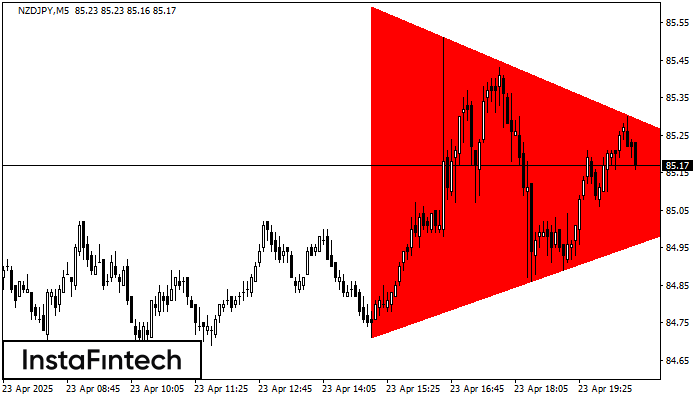
According to the chart of M5, NZDJPY formed the Bearish Symmetrical Triangle pattern. Trading recommendations: A breach of the lower border 84.71 is likely to encourage a continuation
The M5 and M15 time frames may have more false entry points.
Open chart in a new window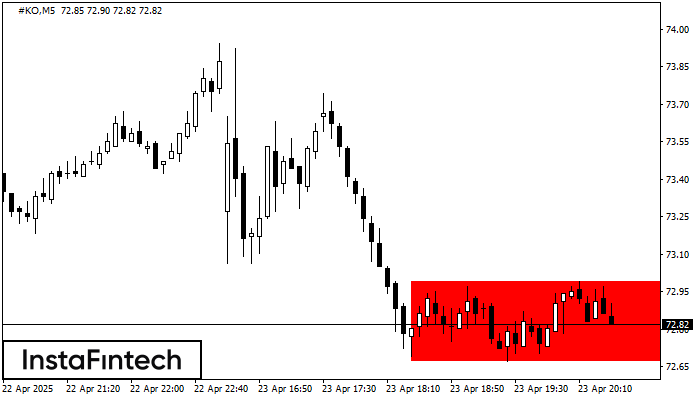
According to the chart of M5, #KO formed the Bearish Rectangle which is a pattern of a trend continuation. The pattern is contained within the following borders: lower border 72.67
The M5 and M15 time frames may have more false entry points.
Open chart in a new window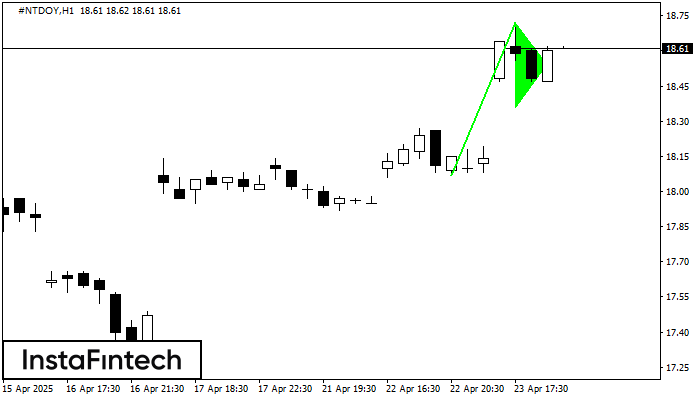
The Bullish pennant pattern is formed on the #NTDOY H1 chart. It is a type of the continuation pattern. Supposedly, in case the price is fixed above the pennant’s high
Open chart in a new window