


signal strength 1 of 5
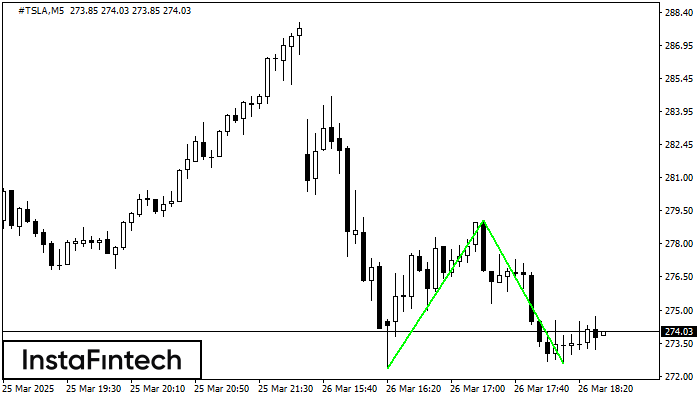
The Double Bottom pattern has been formed on #TSLA M5. Characteristics: the support level 272.37; the resistance level 279.03; the width of the pattern 666 points. If the resistance level is broken, a change in the trend can be predicted with the first target point lying at the distance of 645 points.
The M5 and M15 time frames may have more false entry points.
Xem thêm
- All
- Double Top
- Flag
- Head and Shoulders
- Pennant
- Rectangle
- Triangle
- Triple top
- All
- #AAPL
- #AMZN
- #Bitcoin
- #EBAY
- #FB
- #GOOG
- #INTC
- #KO
- #MA
- #MCD
- #MSFT
- #NTDOY
- #PEP
- #TSLA
- #TWTR
- AUDCAD
- AUDCHF
- AUDJPY
- AUDUSD
- EURCAD
- EURCHF
- EURGBP
- EURJPY
- EURNZD
- EURRUB
- EURUSD
- GBPAUD
- GBPCHF
- GBPJPY
- GBPUSD
- GOLD
- NZDCAD
- NZDCHF
- NZDJPY
- NZDUSD
- SILVER
- USDCAD
- USDCHF
- USDJPY
- USDRUB
- All
- M5
- M15
- M30
- H1
- D1
- All
- Buy
- Sale
- All
- 1
- 2
- 3
- 4
- 5
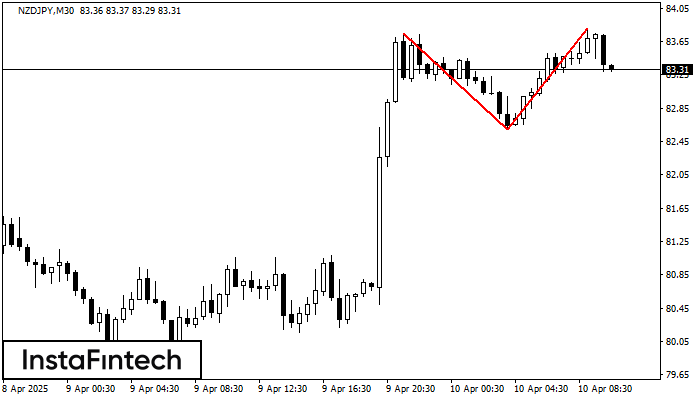
The Double Top reversal pattern has been formed on NZDJPY M30. Characteristics: the upper boundary 83.75; the lower boundary 82.60; the width of the pattern is 120 points. Sell trades
Open chart in a new window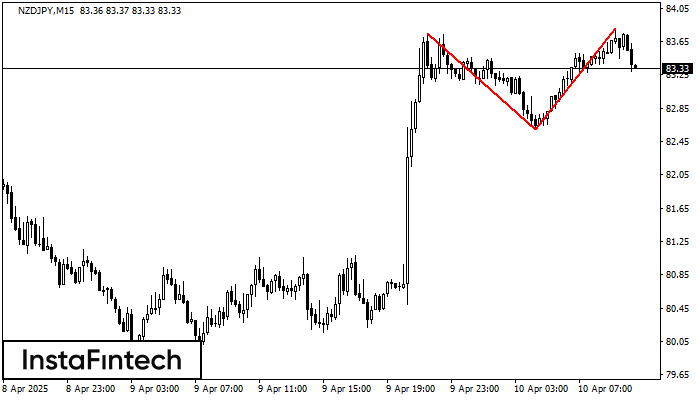
On the chart of NZDJPY M15 the Double Top reversal pattern has been formed. Characteristics: the upper boundary 83.80; the lower boundary 82.60; the width of the pattern 120 points
The M5 and M15 time frames may have more false entry points.
Open chart in a new window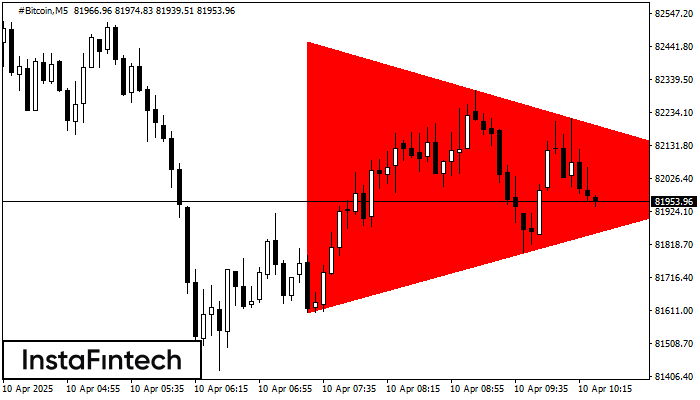
According to the chart of M5, #Bitcoin formed the Bearish Symmetrical Triangle pattern. Trading recommendations: A breach of the lower border 81606.61 is likely to encourage a continuation
The M5 and M15 time frames may have more false entry points.
Open chart in a new window


